The 5 Reports That Predict Your Future
Most business owners only look backward — profit, expenses, taxes.
But the smart ones? They look forward.
Your numbers aren’t just history. They’re your early warning system.
When you know how to read them, you can predict cash flow dips, spot growth opportunities, and steer clear of surprises before they happen.
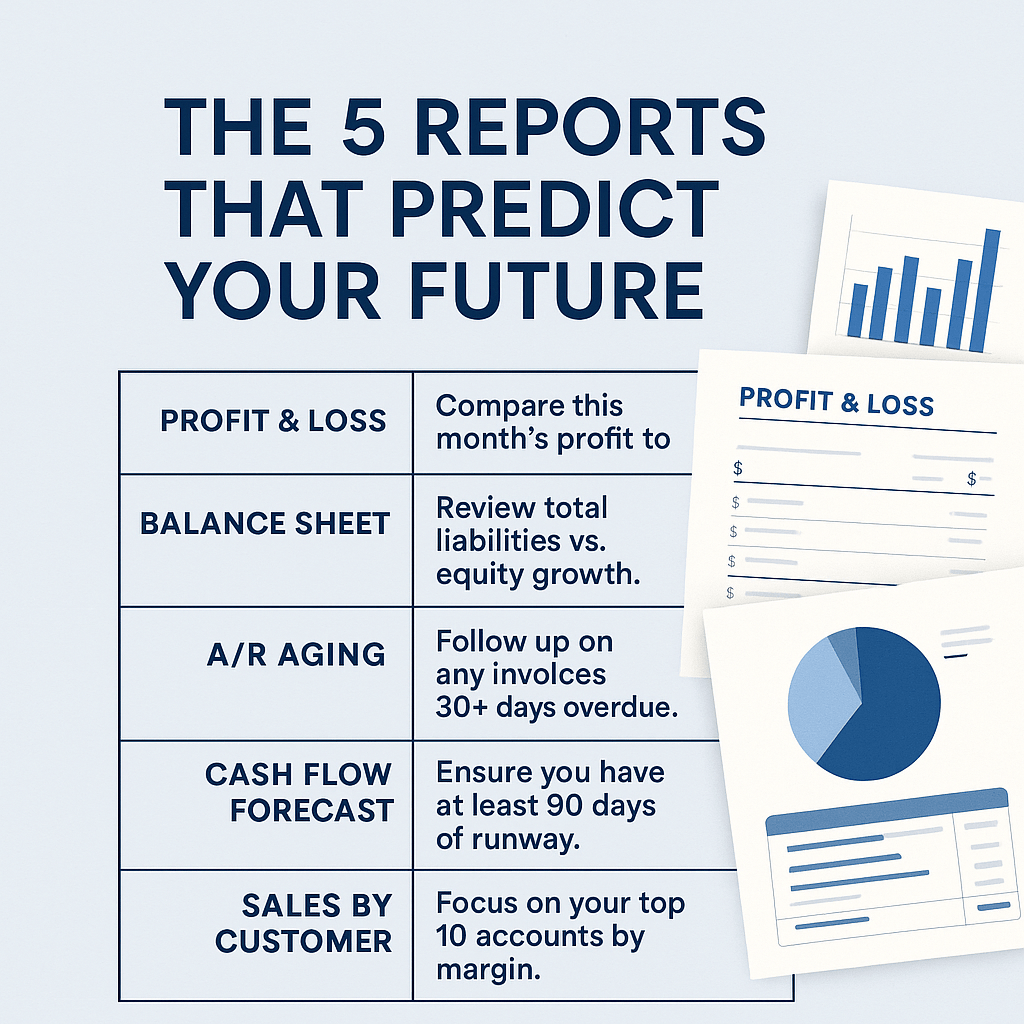
Here are the five QuickBooks Online reports that reveal what’s next for your business — not just what’s already happened.
1. Profit & Loss (P&L) — Your Health Report
The P&L tells the story of your business month by month.
When tracked over time, it becomes your heartbeat.
Watch for these:
Gross Profit Margin: If it’s dropping, costs are climbing faster than revenue.
Operating Expenses Ratio: Compare it to last quarter — are overhead costs creeping up?
💡 Pro Tip: Run your P&L by month for the year to visualize patterns and seasonality.
2. Balance Sheet — The Stability Test
Your balance sheet shows what you own versus what you owe.
It’s how you know if your business is healthy — or heavily leveraged.
Assets growing faster than liabilities? You’re building stability.
Debt climbing while cash stays flat? That’s a red flag.
💡 Pro Tip: Compare this report year-over-year to see if your equity is trending in the right direction.
3. Accounts Receivable (A/R) Aging — The Cash Flow Crystal Ball
Revenue means nothing until it’s collected.
The A/R Aging report tells you exactly who owes you, how much, and how long it’s been.
When you review it weekly, you can prevent cash crunches before they start.
💡 Pro Tip: Send automatic reminders for invoices past 30 days due — it’s free inside QBO.
4. Cash Flow Forecast — Your Runway
Your cash flow forecast shows whether you’ll have enough to cover upcoming bills, payroll, and taxes.
It’s the one report that helps you sleep at night.
💡 Pro Tip: Project 90 days ahead using your average inflows and outflows. That’s your “runway.”
5. Sales by Customer Summary — Your Growth GPS
Not all customers are equal.
This report shows who’s driving your business — and who might be costing you.
When you know your top 10 clients, you can focus your marketing, improve service, and say goodbye to the ones draining your time and energy.
💡 Pro Tip: Filter by gross profit, not just revenue, to find your truly profitable clients.
📊 Quick Summary Table
| Report | Why It Matters | Action to Take |
|---|---|---|
| Profit & Loss | Reveals trends in revenue, costs, and profit margins. | Compare this month’s profit to the same month last year. |
| Balance Sheet | Shows overall financial stability. | Review total liabilities vs. equity growth. |
| A/R Aging | Predicts cash flow issues. | Follow up on any invoices 30+ days overdue. |
| Cash Flow Forecast | Projects future liquidity. | Ensure you have at least 90 days of runway. |
| Sales by Customer | Highlights profitable clients. | Focus on your top 10 accounts by margin. |
Why This Matters
You don’t need to be a CFO to think like one.
When you use data to anticipate instead of react, you control your business — it doesn’t control you.
💡 Action Step:
Schedule automatic monthly report emails in QuickBooks Online.
Start with your P&L, Balance Sheet, and A/R Aging.
Let your numbers tell you what’s coming before it hits.