
The MSP Chart of Accounts: How to Structure QuickBooks for Better Financial Visibility
If you've ever looked at your Profit & Loss statement and thought...
"This doesn't really tell me anything."
...your Chart of Accounts may be the real problem.
Many MSP owners assume bookkeeping is simply recording transactions.
In reality, the way your Chart of Accounts is organized determines whether your financial reports provide useful business insights—or simply list numbers on a page.
A well-designed Chart of Accounts helps answer questions like:
Is recurring revenue growing?
Are projects profitable?
How much are software vendors costing us?
Are hardware sales making money?
Is labor consuming too much revenue?
If your accounts aren't structured properly, those answers are difficult—or impossible—to find.
What Is a Chart of Accounts?
Your Chart of Accounts is the framework behind every financial report in QuickBooks.
Think of it as the filing system for your business.
Every invoice.
Every bill.
Every payroll expense.
Every software subscription.
Every hardware purchase.
Everything eventually lands in one of these accounts.
If the structure is poor, the reports will be poor.
If the structure is thoughtful, your reports become powerful management tools.
Why Generic QuickBooks Setups Don't Work Well for MSPs
QuickBooks is designed to work for thousands of different industries.
Restaurants.
Construction companies.
Retail stores.
Law firms.
Manufacturers.
Managed Service Providers operate very differently.
Most MSPs have a mix of:
Monthly recurring revenue (MRR)
Project work
Hardware sales
Software licensing
Microsoft CSP revenue
Professional services
Cybersecurity services
Vendor subscriptions
Contractor labor
Trying to squeeze all of that into a generic QuickBooks setup often results in reports that don't provide meaningful insights.
Common Chart of Accounts Mistakes MSPs Make
Here are a few issues I see regularly.
One Giant "Sales" Account
If every dollar of revenue goes into a single income account, you lose visibility into what's actually driving your business.
Recurring revenue.
Projects.
Hardware.
Consulting.
Software resale.
They're all different revenue streams.
Treating them as one number hides valuable information.
One Giant Cost of Goods Sold Account
The same problem happens with expenses.
If technician payroll...
Microsoft licensing...
Cybersecurity subscriptions...
Hardware purchases...
and contractor labor are all grouped together, you can't identify where your margins are changing.
Mixing Hardware and Services
Selling a firewall isn't the same as managing it.
Installing a server isn't the same as supporting it.
Hardware revenue and service revenue should generally be tracked separately so you can evaluate each part of the business independently.
Burying Vendor Costs
Most MSPs rely on numerous software vendors.
Microsoft.
Huntress.
Datto.
SentinelOne.
Sophos.
Proofpoint.
NinjaOne.
HaloPSA.
If those costs are buried in a generic expense account, you'll have a harder time understanding how vendor pricing affects profitability.
A Better Income Structure
Every MSP is different, but many benefit from separating revenue into logical categories.
Recurring Revenue
Managed Services (MRR)
Co-Managed IT
Help Desk Services
Cybersecurity Services
Monitoring Services
Project Revenue
Projects
Installations
Migrations
Consulting
Professional Services
Product Revenue
Hardware Sales
Software Resale
Microsoft Licensing
VoIP Services
Backup Services
When these revenue streams are separated, your monthly financial reports become much easier to understand.
Organize Cost of Goods Sold
Cost of Goods Sold (COGS) represents the direct costs of delivering your services.
Examples may include:
Technician payroll
Contractor labor
Software licensing
Microsoft CSP costs
Cybersecurity subscriptions
Backup platform costs
Hardware purchases
Separating these costs allows you to monitor gross margin more effectively and identify where costs are increasing over time.
Keep Operating Expenses Organized
Your operating expenses are the costs of running your business that aren't directly tied to delivering client services.
Examples include:
Rent
Insurance
Marketing
Office expenses
Internet
Telephone
Professional fees
Payroll taxes
Continuing education
Software subscriptions used to operate the business
A clean separation between Cost of Goods Sold and Operating Expenses provides a much clearer picture of overall profitability.
Better Reports Lead to Better Decisions
A well-designed Chart of Accounts helps transform your financial reports from accounting documents into management tools.
Instead of asking:
"Did we make money this month?"
You can begin asking much better questions.
Is recurring revenue increasing?
Are software costs growing faster than revenue?
Are projects generating healthy margins?
Has contractor labor increased?
Are hardware sales still profitable?
Which revenue streams deserve more attention?
Those are the questions that help business owners make better decisions.
Don't Overcomplicate It
One mistake some business owners make is creating hundreds of accounts.
More isn't always better.
The goal isn't to build the longest Chart of Accounts possible.
The goal is to organize your financial information so your reports answer the questions that matter most to your business.
If you rarely use an account, you probably don't need it.
If several accounts always move together and don't provide meaningful insight separately, consider simplifying them.
A Chart of Accounts should be detailed enough to support decision-making—but simple enough to maintain consistently.
Your Chart of Accounts Should Grow With Your MSP
As your business evolves, your Chart of Accounts should evolve too.
When you introduce new services...
Add cybersecurity offerings...
Begin selling Microsoft licensing...
Expand into VoIP...
Or launch new recurring revenue streams...
Your accounting system should reflect those changes.
Your financial reports should grow alongside your business.
Accurate Bookkeeping Starts With the Right Foundation
Many bookkeeping problems aren't caused by incorrectly categorized transactions.
They're caused by an accounting structure that was never designed for an MSP.
When your Chart of Accounts is organized properly, everything else becomes easier.
Monthly bookkeeping.
Financial reporting.
Budgeting.
Gross margin analysis.
Cash flow forecasting.
Business planning.
The right foundation makes every financial decision more informed.
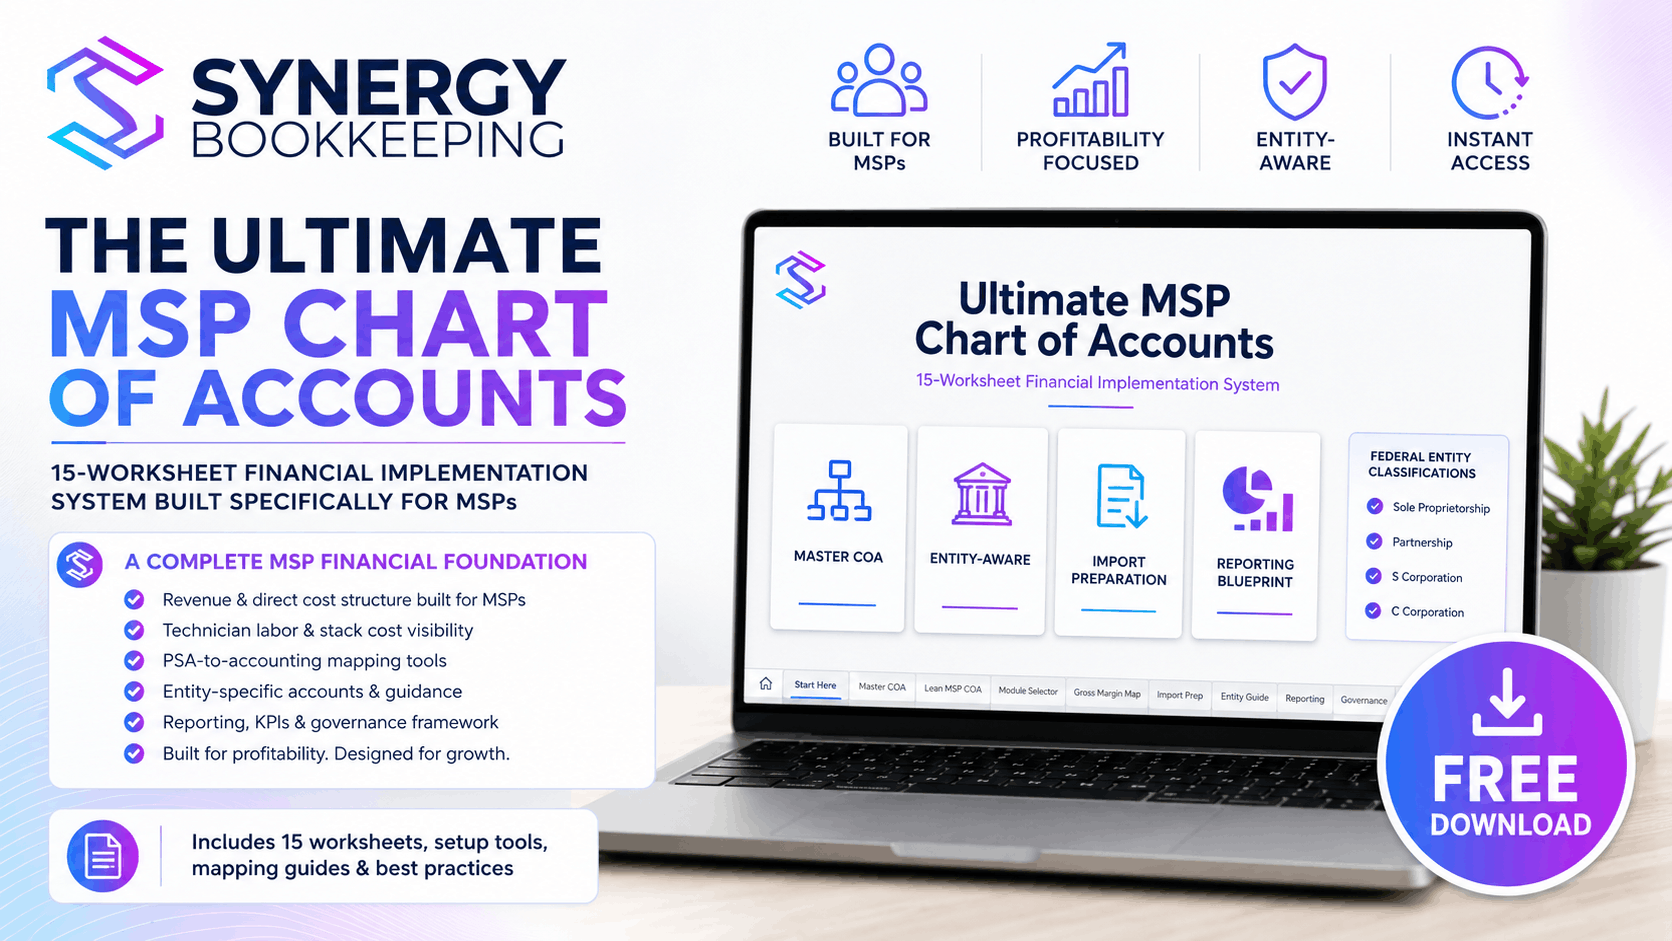
FREE MSP QUICKBOOKS TOOL
The Ultimate MSP Chart of Accounts
Build a cleaner financial foundation for your MSP with a curated Lean MSP structure, complete modular framework, account-mapping tools, gross-margin guidance, and QuickBooks import preparation.
📘 Continue Exploring The MSP Financial Playbook
Looking for more practical guidance on cash flow, profitability, QuickBooks, financial reporting, KPIs, and bookkeeping for Managed Service Providers?
Explore our growing library of practical articles written by an MSP owner for MSP owners.
👉 Explore The MSP Financial Playbook
Need Help With Your MSP's Books?
If you'd rather spend your time growing your MSP than managing QuickBooks, learn more about our specialized bookkeeping services designed specifically for Managed Service Providers.
Ready to Talk?
If your QuickBooks file needs cleanup, your Chart of Accounts needs restructuring, or you simply want a second opinion on your financial reporting, we'd be happy to help.
Schedule your Free 15-Minute QuickBooks Review and let's discuss how your books can better support your business.